Discover posts




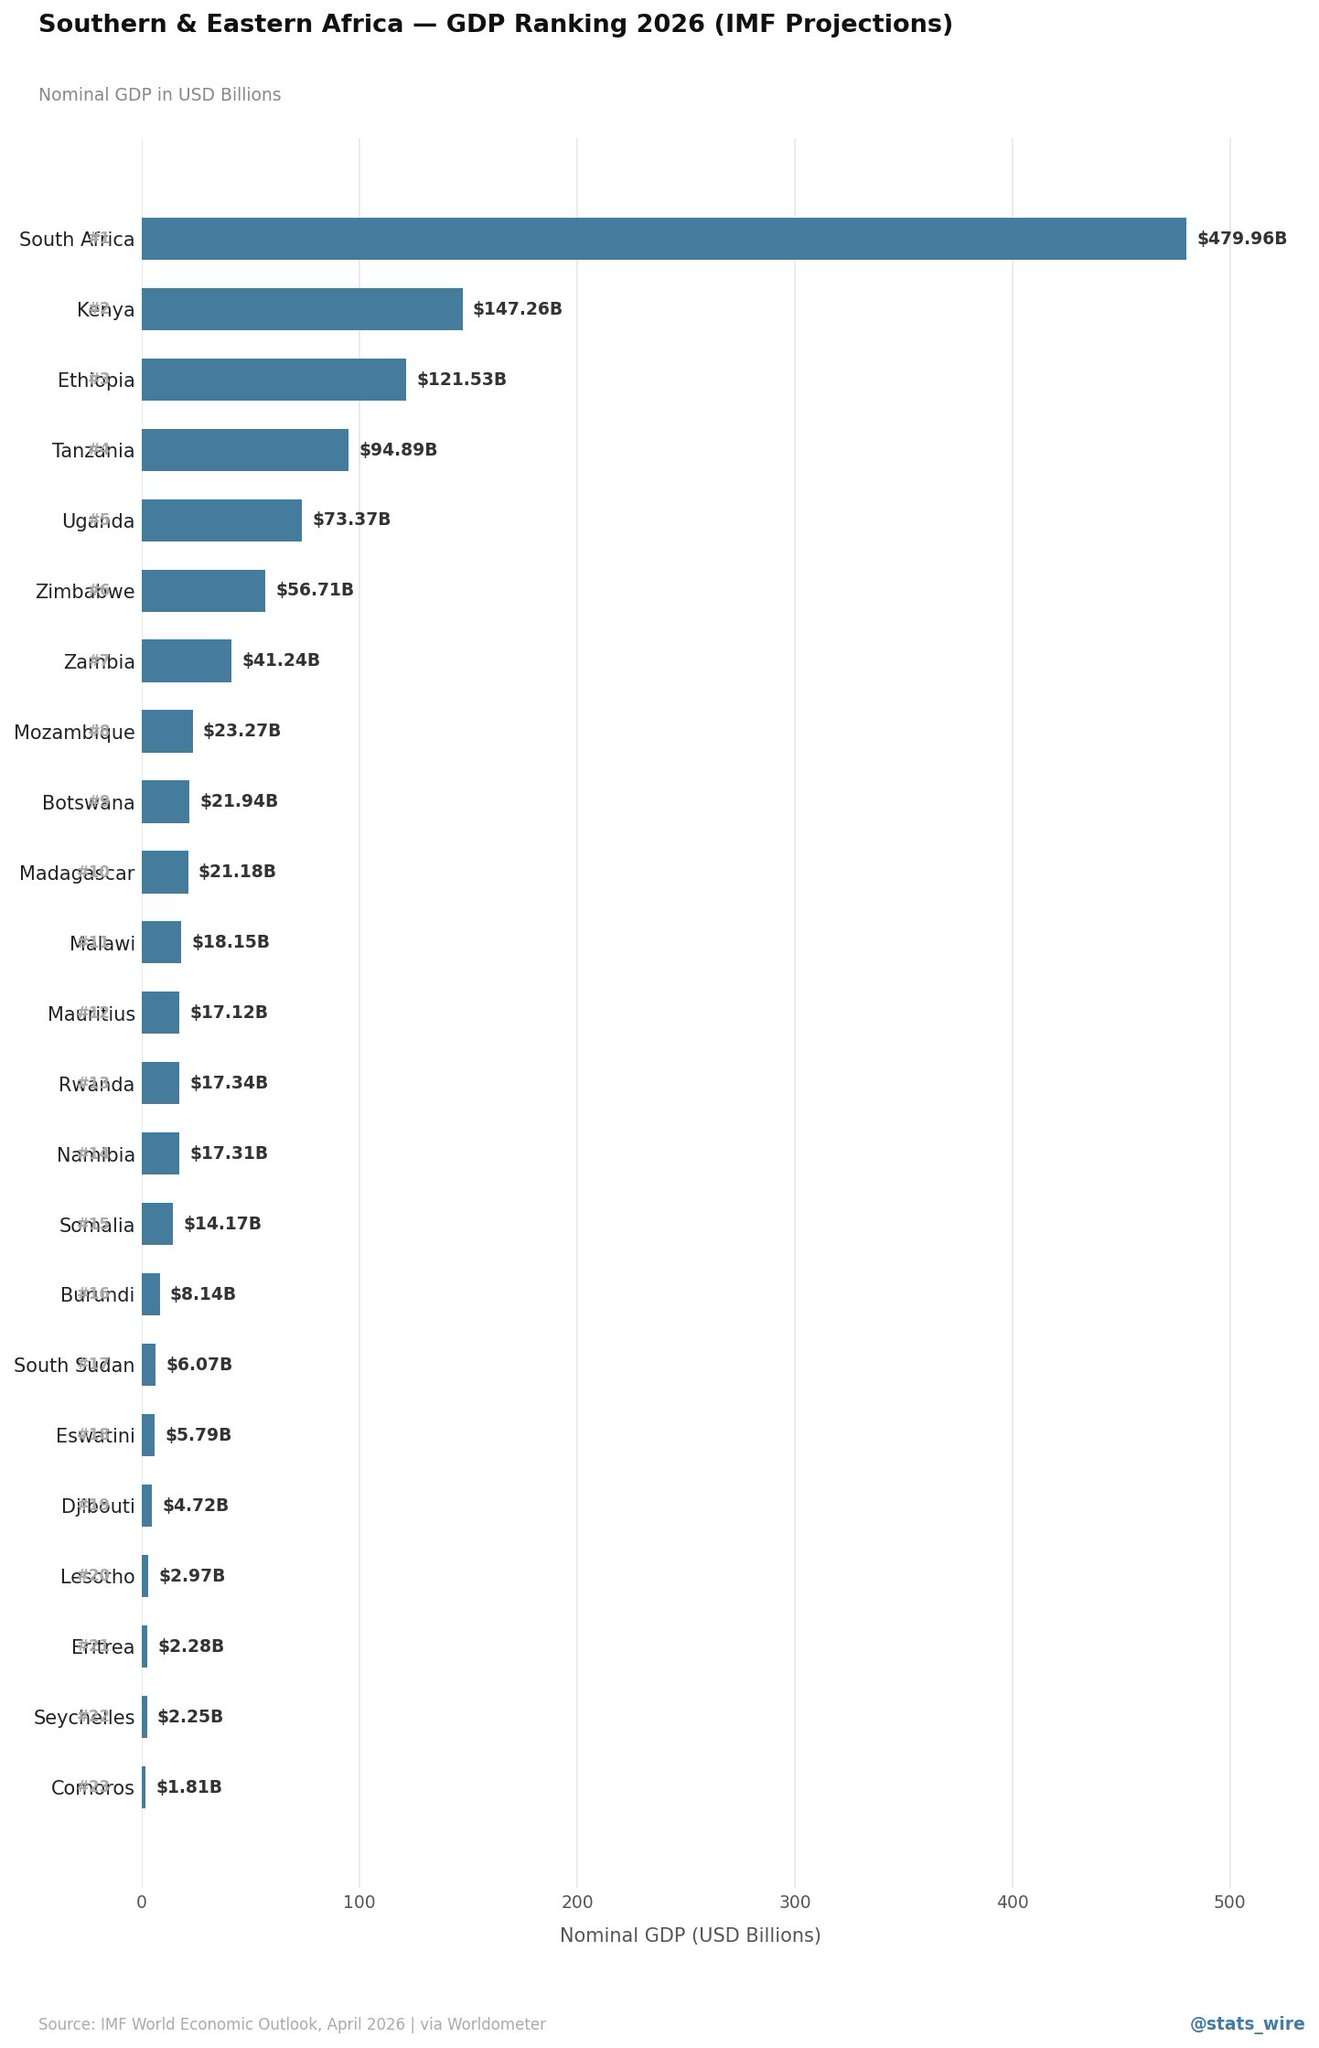
Southern & Eastern Africa GDP 2026 (IMF)
1. 🇿🇦 South Africa: $479.96B
2. 🇰🇪 Kenya: $147.26B
3. 🇪🇹 Ethiopia: $121.53B
4. 🇹🇿 Tanzania: $94.89B
5. 🇺🇬 Uganda: $73.37B
6. 🇿🇼 Zimbabwe: $56.71B
7. 🇿🇲 Zambia: $41.24B
8. 🇲🇿 Mozambique: $23.27B
9. 🇧🇼 Botswana: $21.94B
10. 🇲🇬 Madagascar: $21.18B
11. 🇲🇼 Malawi: $18.15B
12.🇷🇼 Rwanda: $17.34B
13.🇳🇦 Namibia: $17.31B
14.🇲🇺 Mauritius: $17.12B
15.🇸🇴 Somalia: $14.17B
16.🇧🇮 Burundi: $8.14B
17.🇸🇸 South Sudan: $6.07B
18.🇸🇿 Eswatini: $5.79B
19.🇩🇯 Djibouti: $4.72B
20.🇱🇸 Lesotho: $2.97B
21.🇪🇷 Eritrea: $2.28B
22.🇸🇨 Seychelles: $2.25B
23.🇰🇲 Comoros: $1.81B
Southern & Eastern Africa GDP 2026 (IMF)
1. 🇿🇦 South Africa: $479.96B
2. 🇰🇪 Kenya: $147.26B
3. 🇪🇹 Ethiopia: $121.53B
4. 🇹🇿 Tanzania: $94.89B
5. 🇺🇬 Uganda: $73.37B
6. 🇿🇼 Zimbabwe: $56.71B
7. 🇿🇲 Zambia: $41.24B
8. 🇲🇿 Mozambique: $23.27B
9. 🇧🇼 Botswana: $21.94B
10. 🇲🇬 Madagascar: $21.18B
11. 🇲🇼 Malawi: $18.15B
12.🇷🇼 Rwanda: $17.34B
13.🇳🇦 Namibia: $17.31B
14.🇲🇺 Mauritius: $17.12B
15.🇸🇴 Somalia: $14.17B
16.🇧🇮 Burundi: $8.14B
17.🇸🇸 South Sudan: $6.07B
18.🇸🇿 Eswatini: $5.79B
19.🇩🇯 Djibouti: $4.72B
20.🇱🇸 Lesotho: $2.97B
21.🇪🇷 Eritrea: $2.28B
22.🇸🇨 Seychelles: $2.25B
23.🇰🇲 Comoros: $1.81B
Southern & Eastern Africa GDP 2026 (IMF)
1. 🇿🇦 South Africa: $479.96B
2. 🇰🇪 Kenya: $147.26B
3. 🇪🇹 Ethiopia: $121.53B
4. 🇹🇿 Tanzania: $94.89B
5. 🇺🇬 Uganda: $73.37B
6. 🇿🇼 Zimbabwe: $56.71B
7. 🇿🇲 Zambia: $41.24B
8. 🇲🇿 Mozambique: $23.27B
9. 🇧🇼 Botswana: $21.94B
10. 🇲🇬 Madagascar: $21.18B
11. 🇲🇼 Malawi: $18.15B
12.🇷🇼 Rwanda: $17.34B
13.🇳🇦 Namibia: $17.31B
14.🇲🇺 Mauritius: $17.12B
15.🇸🇴 Somalia: $14.17B
16.🇧🇮 Burundi: $8.14B
17.🇸🇸 South Sudan: $6.07B
18.🇸🇿 Eswatini: $5.79B
19.🇩🇯 Djibouti: $4.72B
20.🇱🇸 Lesotho: $2.97B
21.🇪🇷 Eritrea: $2.28B
22.🇸🇨 Seychelles: $2.25B
23.🇰🇲 Comoros: $1.81B
The African Nations left at the 2026 FIFA world cup:
1. Morocco 🇲🇦 ✅
2. Cape Verde 🇨🇻
3. Egypt 🇪🇬
4. Ghana 🇬🇭
4 out of 10 left. Only one country has qualified for the Round of 16 knockout stage.




Permeable Concrete Market Gains Momentum as Sustainable Infrastructure Investments Rise Worldwide
https://growthmarketreports.co....m/report/permeable-c
The global permeable concrete market reached USD 22.8 billion in 2025, driven by surging demand for sustainable urban drainage and green infrastructure.
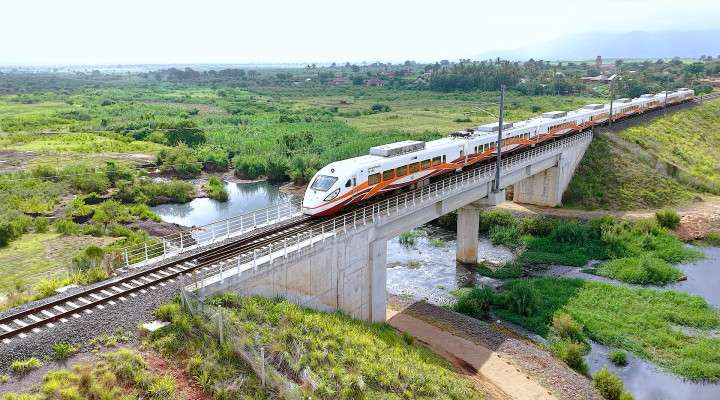
Tanzania ranks 5th in Africa for the longest railway network:
1. 🇿🇦 South Africa: 30,400km
2. 🇸🇩 Sudan: 7,251km
3. 🇪🇬 Egypt: 5,085km
4. 🇲🇿 Mozambique: 4,787km
5. 🇹🇿 Tanzania: 4,097km
6. 🇩🇿 Algeria: 4,020km
7. 🇨🇩 DRC: 4,007 km
8. 🇰🇪 Kenya: 3,819km
9. 🇳🇬 Nigeria: 3,798km
10. 🇿🇼 Zimbabwe: 3,427km
Ammonium Dimolybdate Market Gains Momentum with Rising Demand from Catalysts, Chemicals, and Advanced Industrial Applications
https://growthmarketreports.co....m/report/ammonium-di
The global ammonium dimolybdate market stands at USD 963 million in 2025, projected to grow at a 5.3% CAGR through 2034.
Tuyizere Issa Abdu
Trusted Member · 1345Delete Comment
Are you sure that you want to delete this comment ?